
BIG TEN EARLY LEARNING ALLIANCE BRIEF Number 2 — Winter 2025
David Purpura & Patrick Ehrman
Purdue University
Key takeaways
- Early learning standards are intended to lay a foundation for school readiness and long-term success.
- Each state organizes the ages/developmental stages they include in their early learning standards in different ways.
- Early learning standards in mathematics vary substantially across Big Ten states in their level of expectation, precision, and inclusion of content.
- There is limited work in the field that empirically identifies what mathematics skills children should acquire prior to kindergarten entry.
- Collaborative work across states that brings together evidence-based decision making on setting early learning standards in math is needed.
Early Learning Standards
In 2010, the National Governors Association released the Common Core State Standards (CCSS; Common Core State Standards Initiative, 2010) which was intended to be a shared set of academic standards and expectations across all K-12 schools in the United States. The goal was that children in Massachusetts and Missouri would have the same level of expectations as children in Indiana and Iowa. In essence, it was intended to level the playing field for later success by ensuring reasonable and high expectations for all children. Although there has been much criticism and confusion about the CCSS (Clements et al., 2017), they are, in fact, an important component in ensuring equitable access to educational opportunities across the country. Although a few states who initially adopted the CCSS have since transitioned to their own standards, this effort established shared expectations that remain evident in both state-specific standards and the CCSS.
In contrast to K-12 standards, there has not been a consistent effort either to organize expectations for the early learning (i.e. preschool) period across states, or to ensure they are aligned with the CCSS. Recent evidence in early mathematics even suggests that there are some kindergarten standards that are too easy and should be set as preschool standards (Litkowski et al., 2020). Fuson and colleagues (2021) indicate that although some of the kindergarten standards may be too easy for children, they were incorporated into the Kindergarten CCSS for equity purposes, because at the time, most states did not have preschool standards and so they needed to be included in the Kindergarten CCSS standards or be left out entirely.
Decades earlier, some national organizations such as Head Start and the National Council of Teachers of Mathematics (NCTM) already developed various levels of expectations for preschool children’s mathematics performance. For example, Head Start has included performance standards related to mathematics since 1975. Although that version was quite limited in scope (largely noting that children should be provided with opportunities to learn “numerical concepts; spatial, locational and other relationships,” (Office of Head Start, 1975, p.8), later versions of the standards in 1998 and 2016 further defined clearer performance expectations in mathematics. Similarly, in 2000, NCTM released the first set of common and more comprehensive standards for preschool children’s mathematics achievement.
As more states began developing their own standards and preschool enrollment grew around the country, Scott-Little and colleagues (2012) compared the alignment of state early learning standards to each other, and with consensus guidance documents including the Head Start standards (for horizontal alignment; Office of Head Start, 2016) and the Kindergarten CCSS (CCSS, 2010) in mathematics. Notably, they found that there was substantial variation in the alignment of standards within the two guidance documents and across the various state standards. It was their hope that as states updated their early learning standards, they would necessarily become more aligned with consensus documents and with each other.
Goal of This Analysis Brief
Since 2012, every state has updated its early learning standards. Here, we look at the alignment in state early learning standards for mathematics in the 14 states that have Big Ten-affiliated universities. We map out a set of five mathematical standards and their overlap for the 14 states that have Big Ten universities. We selected the topic of mathematics because of the more specific nature of its standards compared to other domains. (Mathematics learning is also the expertise area of the brief’s authors.)
What Standards Were Compared?
Early learning state standards from the 14 Big Ten states were compared by examining the most updated versions of each state’s early learning standards. The most recent updates for state standards were completed between 2012 (Washington) and 2024 (Maryland). Links and brief descriptions of each state document can be found in Table 1.
Table 1. Current state early learning standards, year of publication, and age range covered
| State | Document Title | Year | Ages (years) |
| California | California Preschool/Transitional Kindergarten Learning Foundations (PTKLF) | 2021 | 3 to 5.5 |
| Illinois | Illinois Early Learning and Development Standards | 2013 | 3 to 5 |
| Indiana | Indiana Early Learning Standards | 2023 | Infant to older pre-K |
| Iowa | Iowa Early Learning Standards 3rd Edition | 2018 | 3 to 5 |
| Maryland | Maryland Early Learning Standards 0−48 months | 2024 | Infant to 4* |
| Michigan | Early Childhood Standards of Quality for Birth to Prekindergarten | 2022 | Birth to pre-K |
| Minnesota | Early Childhood Indicators of Progress: Minnesota’s Early Learning Standards: Birth to Kindergarten | 2017 | 3 to 4, 4 to 5 |
| Nebraska | Nebraska’s Birth to Five Learning and Development Standards | 2018 | 3 to 4, 4 to 5 |
| New Jersey | Preschool Teaching and Learning Standards | 2014 | Pre-K |
| Ohio | Ohio’s Early Learning & Development Standards | 2022 | Birth to end of preschool |
| Oregon | Oregon’s Early Learning and Kindergarten Guidelines | 2016 | 3, 4 to 5, kindergarten entry |
| Pennsylvania | Pennsylvania Learning Standards for Early Childhood: Pre-Kindergarten | 2014 | 3 to 5 |
| Washington | Washington State Early Learning and Development Guidelines | 2012 | Birth to third grade |
| Wisconsin | Wisconsin Model Early Learning Standards Fifth Edition | 2017 | 3 to 5 |
Data were mainly extracted from the oldest age category available, with data extracted from the younger age categories only when skills were not listed in the oldest category.
*Maryland recently (2024) updated their early learning standards to remove 48-60 months as they are covered under their 2022 College and Career Readiness standards document. The 2022 College and Career Readiness document is used for the comparisons in this brief.
Challenges in Comparing Standards
Just as standards are different (but related) across elementary grades (e.g., Operations standards in third grade are related to, but different from, Operations standards in second grade), standards or expectations for 3-year-olds should be different from those for 4-year-olds and 5-year-olds given that children’s mathematics skills develop quite rapidly across this period (Litkowski et al., 2020). However, across the 14 Big Ten states, the overall ages included in the early childhood standards and the breakdown of them into smaller age groups was substantially variable (see Table 2). For example, Maryland includes standards for children 0-48 months separately from their standards for children 48-60 months (which are embedded with their K-12 standards), and Washington includes birth to third grade. Some states only include standards for children 3-5 years old (e.g., Illinois, Iowa, Minnesota, Nebraska, Pennsylvania, Wisconsin; California is similar, but lists 3 to 5.5 years old). Still, other states, intentionally do not include specific ages, but rather list developmental periods (e.g., Indiana lists “infant,” “younger toddler,” “older toddler,” “younger preschool,” and “older preschool”) with specific markers by developmental period. Other states include lists of specific developmental markers within content categories, but do not break them down by specific ages (e.g., Ohio).
Table 2. State early learning standards variability of age classification
| State | Age Range | Descriptors |
| California | 3 to 5.5 years | Provides different standards and objectives for children who are 3 to 4.5 years old and children who are 4 to 5.5 years old. |
| Illinois | 3 to 5 years | Provides preschool benchmarks. |
| Indiana | Infant to older pre-K | Provides separate learning goals within each standard for infants, younger toddlers, older toddlers, younger preschoolers, and older preschoolers. |
| Iowa | Birth to 5 years | Provides standards and objectives for infants (birth to 3 years old) and preschoolers (3 to5 years old). |
| Maryland | Infant to 4 years | Provides separate learning objectives within each standard for infants (0 to 8 months), younger toddlers (8 to 18 months), older toddlers (18 to 36 months), and pre-K (36-48 months). |
| Michigan | Birth to pre-K | Provides examples of observable behaviors within each standard for birth to 8 months, 6 to 14 months, 12 to 26 months, 24 to 36 months, 3 years, 4 years, and 5 years. |
| Minnesota | 0 to 5 years | For each subcomponent of a standard, learning objectives are given for 0 to 1 years, 1 to 2 years, 2 to 3 years, 3 to 4 years, and 4 to 5 years. |
| Nebraska | 0 to 5 years | Within each standard, provides learning objectives for birth to 9 months, 7 to 20 months, 18 to 36 months, 3 to 4 years, and 4 to 5 years. |
| New Jersey | Pre-K | Provides preschool indicators |
| Ohio | Birth to end of pre-K | Provides developmental indicators leading up to the end of pre-K. |
| Oregon | 3 years to kindergarten entry | Provides the developmental progression of skills from standards for age 3 and age 4 to 5/not yet in kindergarten, in addition to indicators children should reach by kindergarten entry. |
| Pennsylvania | 3 to 5 years | Provides concepts and competencies preschoolers should understand and achieve. |
| Washington | 0 to 5 years | Provides guidelines from birth to 11 months, 9 to 18 months, 16 to 36 months, 3 to 4 years, and 4 to 5 years. |
| Wisconsin | 3 to 5 years | Provides developmental continuum for each standard starting at 3 years old and going to 5 years old. |
| Head Start | 3 to 5 years | Provides a developmental progression from 36 months to 60 months in addition to indicators children should reach by 60 months. |
There is also substantial variability in how states break down specific age ranges within their broader age range. For example, Iowa breaks their standards into two categories (0 to 3 years old, 3 to 5 years old), whereas Minnesota breaks their standards down by individual years. Still, other states use more narrow month markers to distinguish categories. For example, Maryland identifies “infants” as 0 to 8 months, Indiana categorizes them as the youngest group without specific ages, and Nebraska categorizes them as 0 to 9 months, but also starts their next category at 7 months so there is a two-month overlap.
This variability likely reflects the different states’ approaches to balance the granularity of rapid development of these skills with the wide normative developmental windows in when children acquire these skills. Yet, the variability can make it difficult to directly compare across states and for consistent learning and development experiences to be provided across states. In the later sections, when we compare specific standards, we identify the most advanced indicator of the skill prior to kindergarten entry for consistency. We acknowledge that there is likely even less consistency at the earlier indicators given the variability in age-based categorization, but that is not the focus in this brief.
Variability in State Early Learning Mathematics Standards
The early learning mathematics standards across states vary substantially in their level of expectations, precision of language, and inclusion of content.
Level of Expectations
Verbal counting (the ability to recite the counting sequence starting from the number 1; see Figure 1) has end-of-preschool expectations ranging from “counting to 10” (two states) all the way to “counting to 100” (Wisconsin). Although nine states identify “counting to 20” as the benchmark, two of those states (Oregon and Washington) use language indicating that children should be able to “count up to 20 and beyond.” Additionally, two other states (California and Minnesota) specify that the counting can include errors.
Figure 1. Standards for verbal counting across the 14 Big Ten states
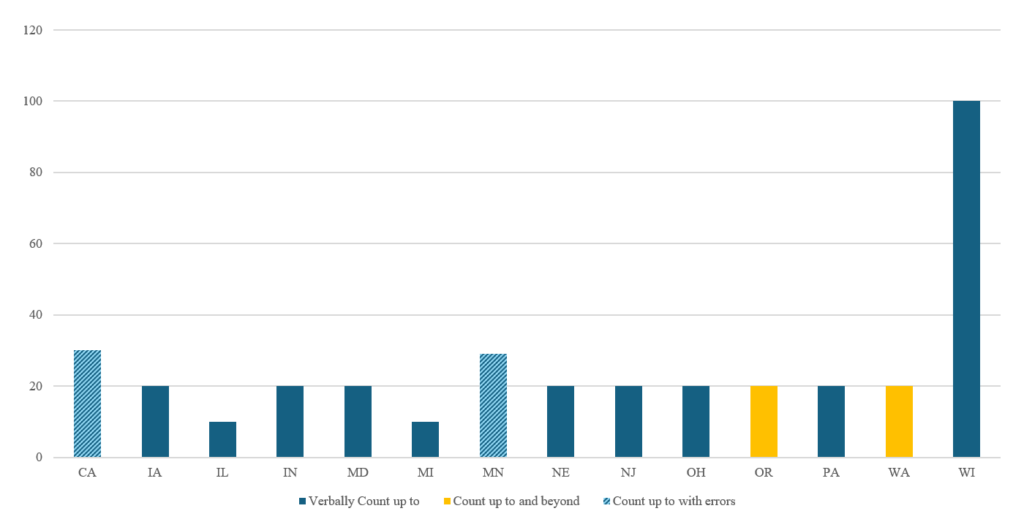
When we look at data-based benchmarks, some state early learning standards do not align with what children can actually do by the end of preschool. Litkowski and colleagues (2020) showed that by the end of preschool, over 90% of children could correctly count to 10. Whereas, between 50 to 75% of children (depending on age) could correctly count to 20, fewer than 20% could count to 100.
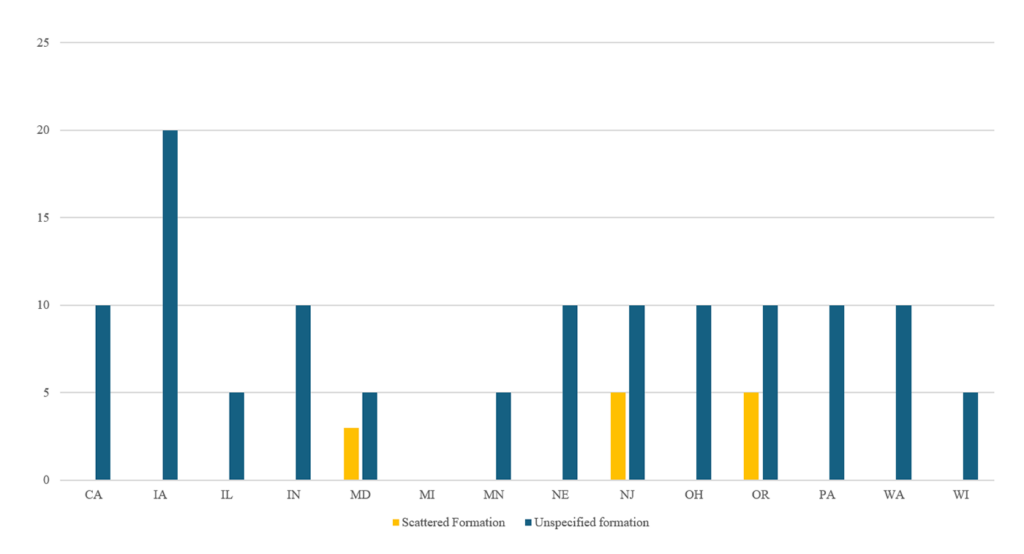
We see very similar variability across state standards in object counting (one-to-one counting; applying one number name to one object) as well (see Figure 2). For example, four states expect that children should be able to count five objects by the end of preschool, eight states list counting 10 objects, one state (Iowa) lists counting 20 objects, and Michigan does not include this as a standard. Additionally, all except three states do not specify the organizational presentation of the objects to be counted, and those states (Maryland, New Jersey, and Oregon) list two different expectations for unorganized sets and organization not specified (but presumed to be in a row). When linked to data on what children can actually do prior to kindergarten entry, Litkowski and colleagues (2020) show that there is some variability in children’s ability to count these quantities at the end of the preschool with 50 to 80% of children being able to count 16 objects (they did not include counting 20 objects) by the end of preschool.
Figure 2. Counting objects standards across 14 Big Ten states
Precision of Language
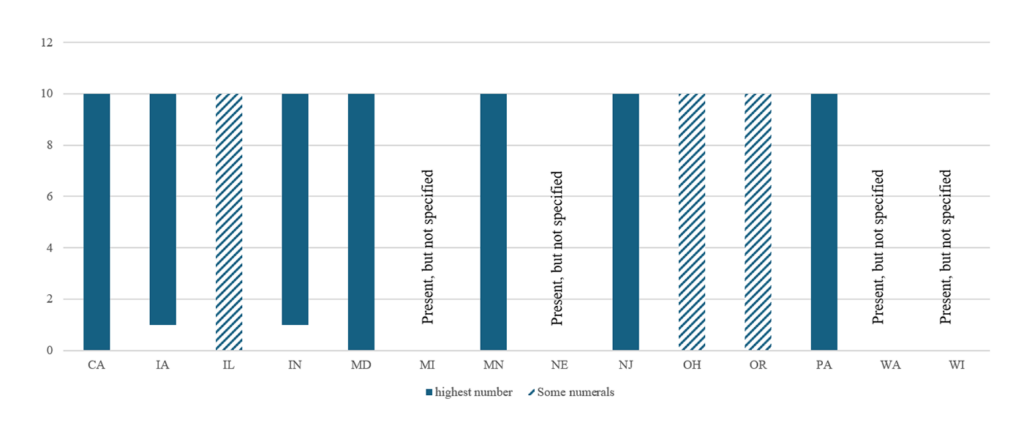
Some states are very specific and give exact numbers children should know, or at least provide targeted ranges of knowledge. Other states use more general language of “some” within a range. For example, in Figure 3, we again see the variability in expectations discussed in the prior section (e.g., some states expect children to know numerals 0 to10 while others say 1 to 10), but there is also substantial variability in how precise these standards are presented. For example, seven states indicate that children should be able to identify numerals up to 10 (some don’t include zero). Three states (Illinois, Ohio, and Oregon) specify that children should know some numerals up to 10 (but do not note which ones or how many of them). Another four states (Michigan, Nebraska, Washington, and Wisconsin) indicate that children should be able to name numerals, but don’t specify which numerals. Without greater specificity in the standards, it is difficult for practitioners to understand what their expectations should be.
Figure 3. Standards for naming numerals across the 14 Big Ten states
Inclusion of Content
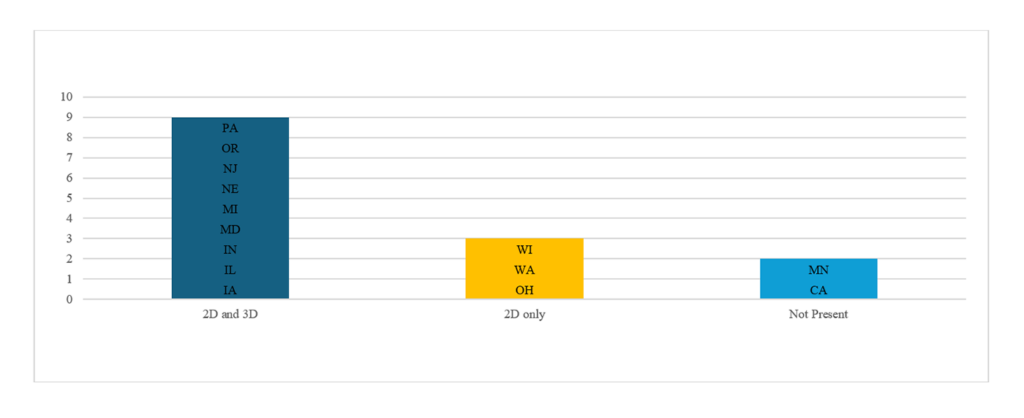
Across the different states, there was also variability in what content areas were included (especially beyond the area of numeracy). Early mathematics is made up of skills across four distinct domains: numeracy, geometry, patterning, and measurement (Milburn et al., 2019). However, there is not general agreement among experts in the field which (beyond numeracy) fit within the domain of early mathematics (see footnote in Hornburg et al., 2021). Notably, out of the 14 Big Ten states, nine include a standard for comparing or sorting 2D and 3D shapes. Three states include only comparing or sorting 2D shapes, and two states (Minnesota and California) do not include comparing or sorting either 2D or 3D shapes (see Figure 4).
Figure 4. Standards for comparing and sorting shapes for the 14 Big Ten states
Similarly, when looking at patterning skills, nine states included extending patterns (adding on to an existing pattern unit) in their standards while five states did not (see Figure 5). This may be reflective of beliefs that patterning skills may be more general cognitive indicators rather than specific to mathematics (Burgoyne et al., 2017), and their lack of inclusion in other standards such as the CCSS (2010). Not including content areas in early learning standards may lead to different foundational sets of knowledge for children across states.
Figure 5. Standards for extending patterns across the 14 Big 10 states
Inconsistent Agreement on Standards
Although there was variability across expectations, there was some general agreement across states in their early learning standards. Notably, seven states listed the same standard for verbal counting (counting up to 20 with no errors), eight states had the same standard for counting objects (counting up to 10 objects), five states shared the same standard of naming all numerals up to 10 including 0 (and another two states had naming numerals 1 to 10), nine states included comparing and sorting both 2D and 3D shapes, and nine states included extending patterns. These most common shared standards are also aligned with current Head Start standards (with the exception that the Head Start standards for verbal counting are counting up to and beyond 20; see Table 3).
Table 3. Head Start standards
| Verbal Counting | Counting Objects | Naming Numerals | Compare/Sort Shapes | Extend Patterns | |
| Head Start | Up to and beyond 20 | 10 — unspecified; five — scattered formation | 0 to 10 | Both 2D and 3D included | Included |
Moreover, even though the most common standards generally aligned with the Head Start standards, there was a lot of inconsistency in which states shared the most common standards. For example, in the verbal counting standard (Figure 1), the most consistent expectation was verbally counting to 20 with no errors which was shared by seven states. In the Counting Objects standard, the most consistent expectation was counting 10 objects (regardless of presentation), which was shared by eight states. However, only five states shared the most consistent expectation for both of those standards. In Table 4, we present the alignment of each state with the most common expectation for each standard and show that the states ranged from one to four common expectations — and no state shared all five most common expectations.
Table 4. Consistency across standards for 14 Big Ten states
| Verbal Counting | Counting Objects | Naming Numerals | Compare/Sort Shapes | Extend Patterns | Total Consistency | |
| California | X | X | X | 3 | ||
| Illinois | X | X | 2 | |||
| Indiana | X | X | X | X | 4 | |
| Iowa | X | X | X | 3 | ||
| Maryland | X | X | X | 3 | ||
| Michigan | X | X | 2 | |||
| Minnesota | X | 1 | ||||
| Nebraska | X | X | X | X | 4 | |
| New Jersey | X | X | X | X | 4 | |
| Ohio | X | X | X | 3 | ||
| Oregon | X | X | X | 3 | ||
| Pennsylvania | X | X | X | X | 4 | |
| Washington | X | 1 | ||||
| Wisconsin | X | 1 |
Total consistency value is the sum of the number of standards for a state that align with the most common presentation of that standard.
The Need for Shared Early Learning Standards
Shared early learning standards help create consistent learning expectations across contexts which would level expectations for young children. In the U.S. there is a consistent lag in mathematics achievement, and critically, substantial variability in how well students in different states perform on average (National Assessment of Educational Progress, 2022). In Big Ten states, mathematics performance in fourth grade ranges from below to above the national average, with year over year variability in performance within and across states (see Figure 6). Moreover, families tend to be quite mobile during early childhood, with an estimated 71% of children moving at least once between birth and kindergarten (Mollborn et al., 2018). Consistent state standards would help to ensure that the instruction that children receive in one state is focused on the same early learning goals as the state they moved from. Finally, consistent state standards could improve the generalizability of research working to understand the development of mathematics concepts. Learning standards influence curricula, which in turn influence what children are taught and expected to know (Porter & Smithson, 2001). As early learning standards provide guidance on the foundational concepts that are the beginning of mathematics learning trajectories (Clements & Sarama, 2009), it is important to ensure that they are consistent and reflect the most up-to-date information on appropriate mathematics content for preschool children to learn.
Figure 6. Average NAEP performance scores in fourth grade across the Big Ten states from 2011 to 2022
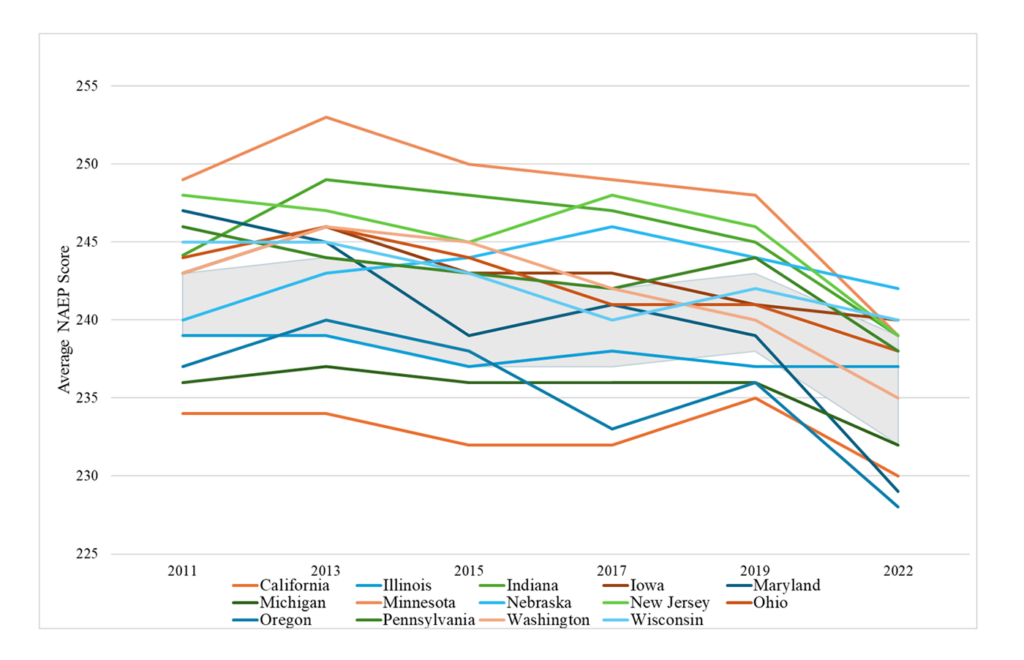
National Assessment of Educational Progress (NAEP) scores in the gray region indicate the state’s average performance in mathematics is not significantly different than the national average. Similarly, average scores above or below the gray region indicate that a state’s performance was above or below, respectively, the national average in a given year.
Advancing Shared Standards
Concerted efforts are needed to align early learning standards across states. School readiness expectations should be the same whether children are in Connecticut and California or Ohio and Oklahoma. This process needs to be collaborative across states, driven by representative data on what children can do at different ages, and be attentive to the variability in normative development windows during these early years. Moreover, early learning standards should be vertically aligned with shared expectations for kindergarten entry and follow research-based learning trajectories (Clements & Sarama, 2009) so that skills and concepts are presented in orders that provide the necessary building blocks for success in mathematics.
References
Burgoyne, K., Witteveen, K., Tolan, A., Malone, S., & Hulme, C. (2017). Pattern Understanding: Relationships With Arithmetic and Reading Development. Child Development Perspectives, 11(4), 239–244. https://doi.org/10.1111/cdep.12240
California Department of Education. (2021). California preschool/transitional kindergarten learning foundations: Mathematics. https://www.cde.ca.gov/sp/cd/re/documents/ptklfmathdomain.pdf
Clements, D. H., & Sarama, J. (2009). Learning trajectories in early mathematics–sequences of acquisition and teaching. Encyclopedia of Language and Literacy Development, 7, 1-6.
Clements, D. H., Fuson, K. C., & Sarama, J. (2017). The research-based balance in early childhood mathematics: A response to Common Core criticisms. Early Childhood Research Quarterly, 40, 150–162. https://doi.org/10.1016/j.ecresq.2017.03.005
Common Core State Standards Initiative (2010). Common Core State Standards for mathematics. https://learning.ccsso.org/wp-content/uploads/2022/11/ADA-Compliant-Math-Standards.pdf
Fuson, K. C., Clements, D. H., & Sarama, J. (2021). Commentary on “Alignment Between Children’s Numeracy Performance, the Kindergarten Common Core State Standards for Mathematics, and State-Level Early Learning Standards.” AERA Open, 7, 233285842110171. https://doi.org/10.1177/23328584211017148
Hornburg, C. B., Borriello, G. A., Kung, M., Lin, J., Litkowski, E., Cosso, J., Ellis, A., King, Y. A., Zippert, E., Cabrera, N. J., Davis-Kean, P., Eason, S. H., Hart, S. A., Iruka, I. U., LeFevre, J.-A., Simms, V., Susperreguy, M. I., Cahoon, A., Chan, W. W. L., … Purpura, D. J. (2021). Next directions in measurement of the home mathematics environment: An international and interdisciplinary perspective. Journal of Numerical Cognition, 7(2), 195–220. https://doi.org/10.5964/jnc.6143
Illinois State Board of Education. (2013). Illinois early learning and development standards. https://www.isbe.net/Documents/early_learning_standards.pdf
Indiana Department of Education. (2024). Indiana early learning standards. https://media.doe.in.gov/news/2023-early-learning-standards-final-5-25-23.pdf
Iowa State Board of Education. (2018). Iowa early learning standards 3rd edition. https://educate.iowa.gov/media/4337/download?inline
Litkowski, E. C., Duncan, R. J., Logan, J. A. R., & Purpura, D. J. (2020). Alignment Between Children’s Numeracy Performance, the Kindergarten Common Core State Standards for Mathematics, and State-Level Early Learning Standards. AERA Open, 6(4), 233285842096854. https://doi.org/10.1177/2332858420968546
Maryland State Department of Education. (2022). Maryland college and career ready standards for mathematics. https://marylandpublicschools.org/about/Documents/DCAA/Math/MCCRSM/MCCRSMPre-Kindergarten.pdf
Maryland State Department of Education. (2024). Maryland early learning standards: 0-48 months. https://earlychildhood.marylandpublicschools.org/maryland-early-learning-standards
Michigan Department of Education, Office of Great Start. (2022). Early childhood standards of quality for birth to kindergarten. https://www.michigan.gov/mileap/-/media/Project/Websites/mileap/Documents/Early-Childhood-Education/gsrp/standards/ECSQ-B-K_Final.pdf
Milburn, T. F., Lonigan, C. J., DeFlorio, L., & Klein, A. (2019). Dimensionality of preschoolers’ informal mathematical abilities. Early Childhood Research Quarterly, 47, 487–495. https://doi.org/10.1016/j.ecresq.2018.07.006
Minnesota Department of Education. (2017). Early childhood indicators of progress: Minnesota’s early learning standards: Birth to kindergarten. https://edocs.dhs.state.mn.us/lfserver/Public/DHS-7596A-ENG
Mollborn, S., Lawrence, E., & Root, E. D. (2018). Residential Mobility Across Early Childhood and Children’s Kindergarten Readiness. Demography, 55(2), 485–510. https://doi.org/10.1007/s13524-018-0652-0
National Assessment of Educational Progress. (2022). The nation’s report card. https://www.nationsreportcard.gov/
National Council of Teachers of Mathematics. (2000). Principles and standards for school mathematics.
Nebraska Department of Education. (2018). Nebraska’s birth to five learning and developmental standards. https://cdn.education.ne.gov/wp-content/uploads/2018/06/ELG-PDF.pdf
New Jersey State Department of Education. (2014). Preschool teaching and learning standards. https://www.nj.gov/education/earlychildhood/preschool/docs/PreschoolTeachingandLearningStandards.pdf
Office of Head Start. (1975). Head Start Program Performance Standards. https://files.eric.ed.gov/fulltext/ED122936.pdf
Office of Head Start. (1998). Head Start Program Performance Standards. https://www.acf.hhs.gov/sites/default/files/documents/opre/meas_98.pdf
Office of Head Start. (2016). Head Start Program Performance Standards. https://eclkc.ohs.acf.hhs.gov/sites/default/files/pdf/performance-standards-final.pdf
Ohio Department of Education. (2022). Ohio’s early learning & development standards. https://education.ohio.gov/getattachment/Topics/Early-Learning/Early-Learning-Content-Standards/Early-Learning-and-Development-Standards.pdf.aspx
Oregon Department of Education. (2016). Oregon’s early learning and kindergarten guidelines. https://www.oregon.gov/ode/students-and-family/Transitioning-to-Kindergarten/Documents/ODE_EarlyLearningStandards_final.pdf
Pennsylvania Department of Education. (2014). Pennsylvania learning standards for early childhood: Pre-kindergarten. https://www.pa.gov/content/dam/copapwp-pagov/en/education/documents/instruction/early-learning/early-learning-standards/early%20learning%20standards%20-%20prekindergarten%202014.pdf
Porter, A. C., & Smithson, J. L. (2001). Chapter IV: Are Content Standards Being Implemented in the Classroom? A Methodology and Some Tentative Answers. Teachers College Record: The Voice of Scholarship in Education, 103(8), 60–80. https://doi.org/10.1177/016146810110300804
Scott-Little, C., Kagan, S. L., Reid, J. L., & Castillo, E. (2012). Early mathematics standards in the United States: The quest for alignment. Heising-Simons Foundation.
Washington Department of Children, Youth, and Families. (2012). Washington state early learning and development guidelines. https://www.dcyf.wa.gov/sites/default/files/pubs/EL_0015.pdf
Wisconsin Department of Public Instruction. (2017). Wisconsin model early learning standards: Fifth edition. https://dpi.wi.gov/sites/default/files/imce/early-childhood/wmels_5theditionfinal.pdf
Author Note
Activities of the Big Ten Early Learning Alliance are supported in part by a generous gift from the American Family Insurance Dreams Foundation to The Ohio State University.
Correspondence about this work may be addressed to David Purpura (purpura@purdue.edu).
The views reflected in this paper are those of the authors and do not represent the Big Ten Academic Alliance or member universities.
The recommended citation for this paper is: Purpura, D., & Ehrman, P. (2025). The State of Early Learning Standards for Mathematics in the Big Ten States: The need for consistent and data-based expectation. Columbus, Ohio: Big Ten Early Learning Alliance.
Acknowledgement
The authors would like to thank members of the Big Ten Early Learning Alliance Steering Committee for their feedback on this brief. The authors would also like to thank the Policy and External Affairs team at the Crane Center for Early Childhood Research and Policy at The Ohio State University: Michael Meckler for copy edits and dissemination; and Janelle Williamson for project management.
About the Big Ten Early Learning Alliance
The Big Ten Early Learning Alliance (Big Ten ELA) is a coalition of early childhood expert scientists at 17 of the institutions of higher education participating in the Big Ten Academic Alliance. As research-intensive universities1 located across 14 states, these Big Ten institutions’ shared profiles enable academic experts to leverage an established network to pursue scientific collaborations focused on addressing critical issues. In this vein, the Big Ten ELA was established in 2023 to collaborate on scientific activities that enhance and expand fundamental knowledge relevant to early childhood development and science-based policies and practices, and to promote the visibility of scientific discoveries relevant to early childhood and its translation for use in policies and practices.
Big Ten ELA institutions are currently located in 14 states: California, Illinois, Indiana, Iowa, Maryland, Michigan, Minnesota, Nebraska, New Jersey, Ohio, Oregon, Pennsylvania, Wisconsin, and Washington.
American Family Insurance Dreams Foundation believes that equity in education — including early education and care — can be a pivotal lever to break cycles of generational poverty for students and their families. Early education and care are leading priorities in our Equity in Education investment strategy. We invest in equity-centered innovation focused on a strong and diverse educator pipeline, research and coalition-building, direct family and community services, and business/funder roundtables.
- At this time of this writing, the Big Ten Early Learning Alliance comprises experts from the University of California – Los Angeles, the University of Illinois Urbana-Champaign, Indiana University, the University of Iowa, the University of Maryland, the University of Michigan, Michigan State University, the University of Minnesota, the University of Nebraska-Lincoln, Northwestern University, The Ohio State University, University of Oregon, the Pennsylvania State University, Purdue University, Rutgers – The State University of New Jersey, the University of Washington and the University of Wisconsin. ↩︎