BIG TEN EARLY LEARNING ALLIANCE BRIEF Number 1 — Fall 2024
This brief is also available in a downloadable PDF version. Click here or on the nearby image to download the PDF version of this brief.
Laura Justice & W. Steven Barnett
The period of early childhood from birth to age 5 years is potentially the most important for enhancing development over the human lifespan. It is in these years that the child’s brain is in a state of very active formation, putting in place the neural pathways in which all future capabilities will be grounded. During this period, to optimize early brain development, it is crucial that young children be provided enriching, supportive experiences and interactions with others. Participation in high-quality early childhood education is one mechanism for providing children with enriching and supportive early experiences and interactions in the years prior to formal schooling, which often begins with kindergarten.
The evidence suggesting that there is a long-term economic payoff for public investments in high-quality early education has been highly influenced by two landmark longitudinal studies that took place in two states with Big Ten Conference member universities. Studies of the Perry Preschool Program in Ypsilanti, Michigan, followed 123 Black children from households with low income who, in the 1960s, either attended a high-quality preschool program or were randomly assigned to a control group. Longitudinal analyses of a cohort of 1,539 children born in 1980 who resided in neighborhoods with high poverty in Chicago tracked participants in the Title 1-funded Chicago Child-Parent Centers, which involved, among other offerings, participation in preschool plus additional resources offered through third grade. Cost-benefit analyses find that for every dollar of public investments in these school-based public preschool programs, between $7 to $10 in benefits to society were realized due to improvements in the participants’ future well-being, increased tax revenues, and reductions in expenditures associated with special education and the criminal justice system. These and other seminal cost-benefit analyses (e.g., Barnett, 1985; Barnett et al., 2020; Reynolds et al., 2011) were conducted by members of The Big Ten Early Learning Alliance (Big Ten ELA).
The Big Ten ELA is a coalition of early childhood expert scientists at the 14 institutions of higher education that were participating in the Big Ten Academic Alliance as of 2023. As research-intensive universities1 located across 11 contiguous states in the Midwest and Middle Atlantic regions of the United States, these Big Ten institutions’ shared profiles enabled academic experts to leverage this established network to pursue scientific collaborations focused on addressing critical issues. In this vein, the Big Ten ELA was established in 2023 to collaborate on scientific activities that enhance and expand fundamental knowledge relevant to early childhood development and science-based policies and practices, and to promote the visibility of scientific discoveries relevant to early childhood and its translation for use in policies and practices.
Big Ten ELA institutions are currently located in 11 states: Illinois, Indiana, Iowa, Maryland, Michigan, Minnesota, Nebraska, New Jersey, Ohio, Pennsylvania, and Wisconsin. More than 900,000 children are born in these states annually, representing one-fourth of all babies born in the United States each year (Centers for Disease Control and Prevention, 2024). In these states, based on data from the U.S. Census Bureau (2022), there are nearly six million residents (5,776,678) between the ages of birth and five years, constituting 26% of American children five years of age and under. For these nearly six million children, it is crucial that their states provide high-quality early childhood education to ensure that these children experience optimal environments and interactions in the earliest years of life. High-quality early childhood education supports not only children’s learning of important academic and social-emotional skills in the short term, but also may confer benefits to these states’ future adult workforce.
The purpose of this inaugural brief from the Big Ten ELA is to describe the characteristics of young children (0 to 5 years) in the 11 Big Ten ELA states; examine the current state of early childhood education among these states; and discuss trends and opportunities for early childhood education in these states.
The Young Children of the 11 Big Ten ELA States
Population size and trends
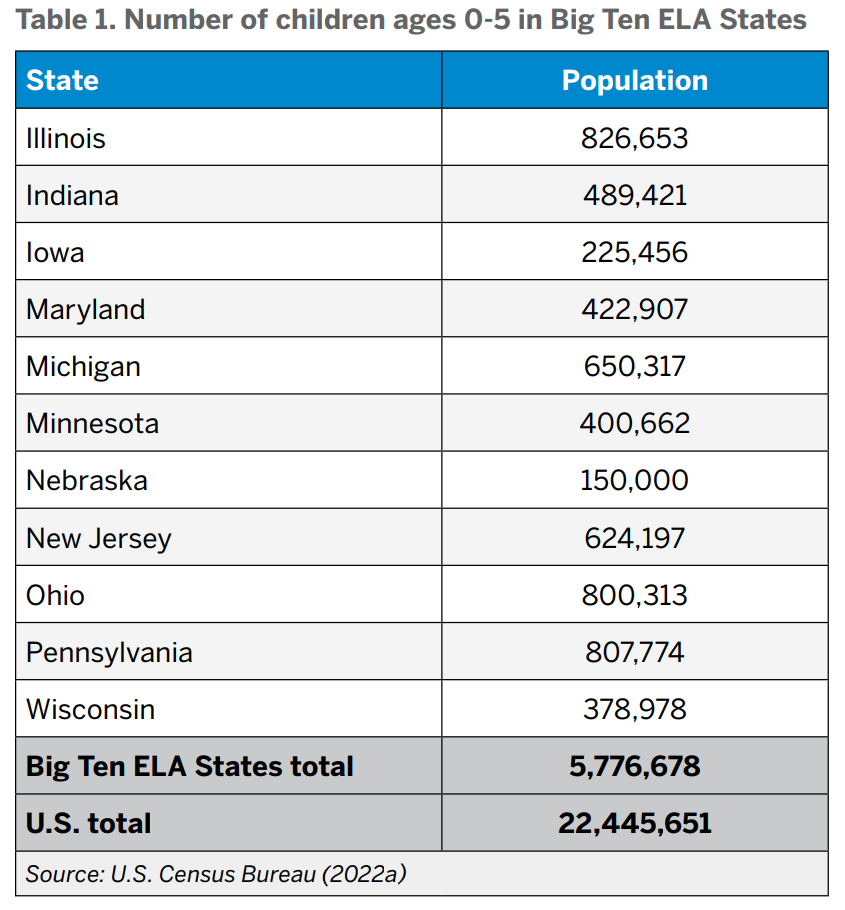
The 11 Big Ten ELA states are home to nearly six million children (5,776,678) between the ages of birth and five years (U.S. Census Bureau, 2022a), representing about one in four American children five years of age and under (see Table 1). Illinois has the largest share of these children (826,653), whereas Nebraska has the smallest (150,000).
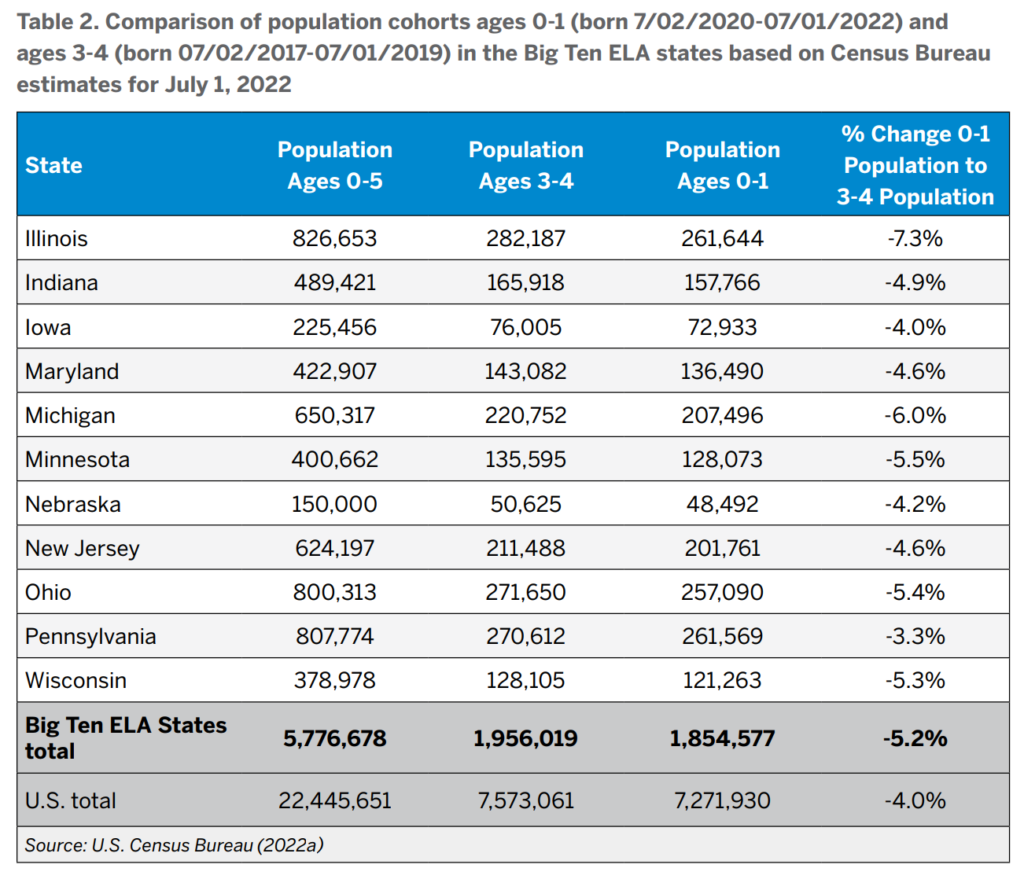
The numbers of children 5 years of age and under across the 11 Big Ten ELA States are expected to fall in the years ahead, as birthrates across these states are declining. As shown in Table 2, there were 974,318 births in the year 2018 across the Big Ten states, which then gradually declined to 925,393 in 2022, a 9.5% decrease over a 4-year period. These trends seen for the 11 Big Ten ELA states model those of the nation, which saw a 9.6% decline in birthrates over these same years.
Poverty in early childhood in the Big Ten ELA states
Among the Big Ten ELA states’ children, nearly 15% are residing in homes below the federal poverty line. Michigan has the greatest number of children residing in homes with low income — 18.2% of children under 18 years of age — whereas Minnesota has the lowest — 10.9% (U.S. Census Bureau, 2022b). In addition, nearly 28% of children under 6 years of age reside in homes in which their mother is the single head-of-household with no spouse present (U.S. Census Bureau, 2022c). Importantly, there is a significant interplay between poverty and single head-of-household status, with poverty rates near 45% in homes with children under age 6 headed by a single female householder (Shrider & Creamer, 2023). For children living in families with incomes below the poverty line, as well as those living in single-parent households, access to high-quality early childhood education may be especially critical, as it is well-established that children experiencing these circumstances tend to start kindergarten behind their higher-income peers in academic skills (Lapointe et al., 2007).
Current State of Early Childhood Education in the 11 Big Ten ELA States
For the present report, we examined the number of children served in publicly funded early childhood education programs, with a focus primarily on 3- and 4-year-old children. We also examined state spending per child. We included information on the number of infants and toddlers (i.e., children under 3 years of age) in programs supported by public funding. Beyond the numbers served, we provide additional information on spending and policies relating to quality for 3- and 4-year-olds in preschool education, as the rationale for preschool programs is to educate young children, and they serve much larger percentages of the population in most states compared to child care subsidy programs.
In preparing this brief, we found that the Big Ten ELA states vary considerably in their approaches to supporting early childhood education. For instance, the states varied with respect to the extent to which they have dedicated state programs for preschool education, childcare subsidy programs, tax credits for early care and education, and other services. In this brief, we report on state-funded preschool programs, preschool special education (primarily delivered in classrooms), the federal Early Head Start and Head Start programs, and state childcare subsidy programs funded largely through the federal Child Care and Development Fund (CCDF) and Temporary Assistance to Needy Families (TANF).
Table 3 provides information on enrollment of children at ages 3 and 4 in state-funded preschool education programs. As can be seen, states differ greatly in the numbers of young children served not only because the states differ in size, but because they serve very different percentages of their populations. Iowa serves the greatest percentage of children in the state (37%) whereas Indiana serves the lowest percentage of children (4%). Also varying greatly, however, are the amounts that states spent per child and the amounts of total spending per child reported, including local funds. On a per-child basis, New Jersey provides the highest amount of state funding ($16,302, serving 58,387 children) whereas Nebraska provides the least ($2,335, serving 12,646 children).
It is important to note that states often do not have complete data on local spending, such as school district expenditures for preschool programming, making it possible that these spending numbers underestimate spending, sometimes considerably. Further, the lack of complete data on local spending also makes cross-state comparisons difficult. The data presented in Table 3, because they do not include local expenditures for early childhood education, may underestimate the number of children served in these states.
Table 3 augments the numerical data on the number of children served in each state plus expenditures, with a final column on the extent to which each state’s early childhood program meets 10 benchmarks that serve as proxies for program quality – such as policies specific to staff qualifications, class size, teacher professional development, and use of continuous improvement systems. States vary widely in the policies they use to guide early childhood program implementation. The 10 benchmarks we utilize are those of the National Institute for Early Education Research (NIEER). States receive 1 point (out of 10) for each benchmark achieved. Those benchmarks are: (1) early learning and development standards, (2) lead teacher credential requirement of bachelor’s degree and (3) specialized training in preschool, (4) assistant teacher credential of CDA or equivalent, (5) professional development and coaching for teachers, (6) class size of 20 or less and (7) teacher-child ratio of 1:10, (8) vision, hearing, and health screenings and referrals for children, (9) curriculum supports, and (10) use of a quality rating improvement system.2 It is important to note that these policy benchmarks provide a floor for supporting quality. Programs achieving a high number of benchmarks do not necessarily offer high-quality programming for children because implementation falls short. Other policies likely to influence quality — funding adequacy, classroom hours per year, and teacher compensation (e.g., pay parity with K-12) — are not encompassed in these quality benchmarks.
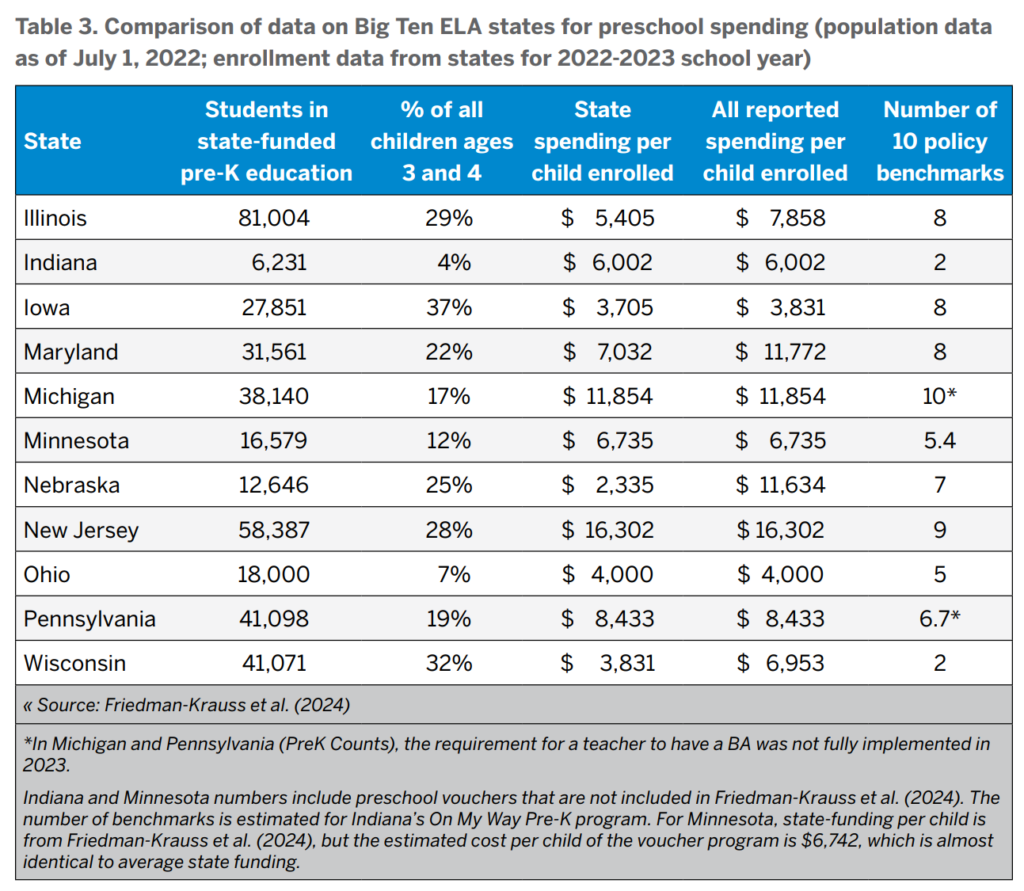
The final column of Table 3 reports the number of policy benchmarks achieved by each state, ranging from 2 for Wisconsin and Indiana to 10 for Michigan. Differences between states in these benchmarks reflect states setting lower standards and/or states that choose to leave standards to local control.
All states also provide educational programs to children with special needs at ages 3 and 4 (early childhood special education), and the federal Head Start program also serves children at these ages. Table 4 includes these children to calculate the total number and percentage of young children in state and federal education programs. These combined numbers are corrected for “dual enrollment,” as children with special needs often are included in the reported state early childhood education numbers, and some children may be served by both state early childhood education and Head Start. For the latter, early childhood education and Head Start may be combined to extend the length of day for a given child, often referred to as “braiding” public funds. In some states, funding may be combined to raise quality to meet higher state standards.
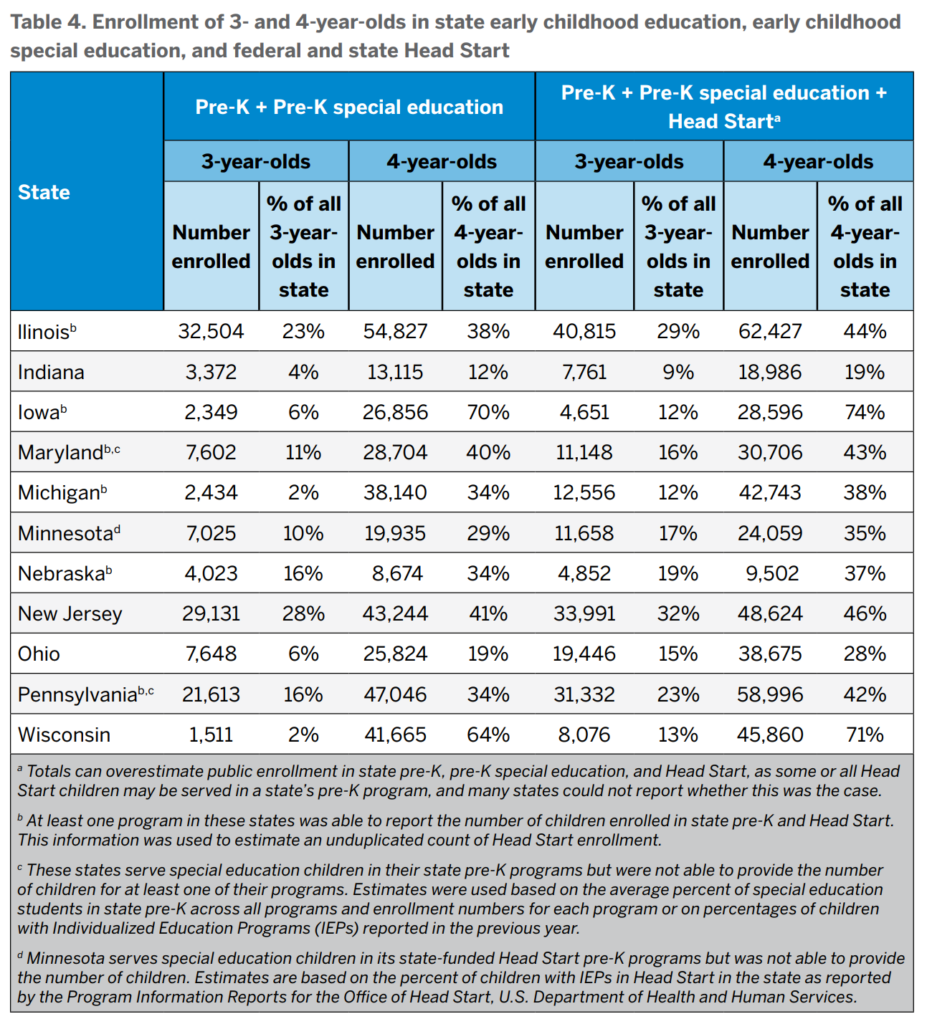
Minnesota, Pennsylvania, and Wisconsin provide state funding to expand Head Start enrollment. State supplements are large enough to be considered separate state-funded early childhood education programs in Minnesota and Pennsylvania, so the additional children are included in their state counts.
Not included in Table 4 are children ages 3 and 4 years who are served by local public schools but who are not in a state-funded or Head Start program. Typically, there is no requirement to report this other enrollment to the state, so most states are unable to track it. Among the Big Ten ELA states, only Illinois reports this additional enrollment, and it would increase the percentage served in Illinois to 35% in Table 3. Unfortunately, we have no way to report similar figures for the other states.
We consider two final categories of early childhood programs in Table 5, namely child care subsidies provided through the CCDF program for children in families with low income, and Early Head Start (EHS). CCDF subsidies support child care for children from birth to age 13. Although CCDF’s primary purpose is to provide support for parents in the workforce or receiving training or education to enhance their workforce skills, when the quality of the care their children receive is sufficiently high, these subsidies can improve children’s learning and development. EHS is a federally funded program designed to support child development prenatally to age 3, and funds can be used to support center- and home-based care for infants and toddlers.
Table 5 presents the most recent data available from state reports to the federal government. As the child care subsidy data are for the fiscal year beginning October 2020, the numbers are somewhat lower than “normal” due to impacts of the COVID-19 pandemic. Nevertheless, it should be noted that percentages served by CCDF at ages 3 and 4 vary across the states. In some states, CCDF numbers are quite small relative to the percentages in state early childhood education, while in several states, those percentages are similar. For instance, Indiana provides state-funded early childhood education to about 4% of all 3- and 4-year-old children, which is comparable to the percentage of children at these ages served by CCDF child care subsidies (4.4%).
The percentages of young children receiving CCDF subsidies are higher for preschoolers than for infants and toddlers in every state. This is consistent with the greater use of nonparental care for preschoolers than for infants and toddlers in general. The percentages with subsidies vary considerably across the states for both age groups.
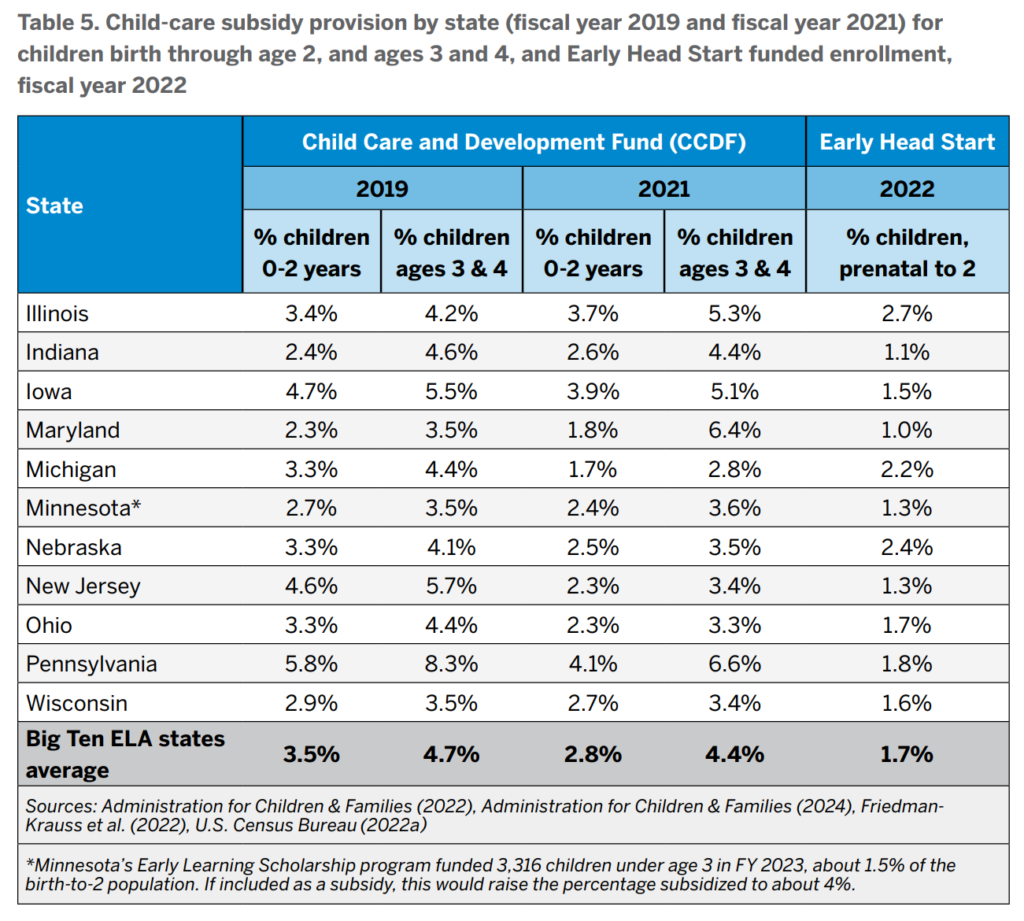
EHS can provide early care and education to infants and toddlers in home- or center-based care and may provide enough hours in a center each week to serve as child care for working parents. The percentage of infants and toddlers served by EHS tends to be lower than the percentage receiving child care subsidies, as can be seen in Table 5. However, in a few states, such as Nebraska, EHS serves about the same percentage of children as the child care subsidy program. Importantly, we have no basis for providing an unduplicated count across the two programs (CCDF subsidies and EHS), although some states may be able to do so, which means that the numbers for EHS and child care subsidies cannot be added together to derive the total receiving free or subsidized care.
Trends and Opportunities for Early Childhood Education in the Big Ten ELA States
This brief characterizes the provision of early childhood education across the Big Ten ELA states with respect to provision of early childhood education, primarily to 3- and 4-year-old children. Across these 11 states are nearly 6,000,000 children 5 years of age and younger who represent the future workforce of these states, should they stay. Ensuring that these youngsters receive quality early childhood education characterized by optimal environments and interactions should be a principal concern of state government entities. As an alliance of early childhood expert scientists, we seek for all young children to have access to high-quality early childhood education, whether it be in the home environment under their families’ care, or some type of external home- or center-based arrangement. To achieve this goal requires considerable public investment in early childhood education, similar to the public investments made in K-12 education across the nation.
This brief highlights the significant investments made at the state level in early childhood education and demonstrates that state-funded preschool programs (for 3- and 4-year-old children) are the largest source of early childhood education in most Big Ten ELA states. However, this brief also documents that Big Ten ELA state investments in early childhood education are highly variable in terms of the percentage of children served and the amount of investment on a per-child basis. Looking specifically at support for 4-year-old children, who experience the highest enrollment rates in early childhood education, we find that in Iowa and Wisconsin, more than 70 percent of 4-year-olds attend a public preschool program. By comparison, in the other states, fewer than half of all 4-year-olds are enrolled.
When considering 3-year-olds, we find that enrollment rates are much lower. However, in two states — Illinois and New Jersey — about 30 percent of 3-year-olds are served when considering both state-funded early childhood education and Head Start. This exceeds the percentage served at age 4 in some other Big Ten ELA states — namely Indiana, Minnesota, and Ohio.
For children under 3 years of age, child-care subsidies support early childhood programming for young children, and together with Early Head State are key sources of public funding that support learning and development for infants and toddlers.
In preparing this brief, the Big Ten ELA encountered significant challenges with the data. Whereas state data systems accurately report the number of children receiving services in any given month, they have important limitations that were observed in compiling this report. First, most Big Ten ELA states cannot produce unduplicated counts across child-care subsidy programs and public preschool. There are some children who utilize both child-care programs and public preschool, and they are likely counted as duplicates in these counts. In this regard, it is not possible to truly identify the number and percentage of children participating in various early childhood education offerings. Second, most Big Ten ELA states cannot report the number of children served by local public school preschool programs who are not also in state-funded preschool or Head Start. These data limitations preclude producing an unduplicated count of children receiving publicly funded early childhood programs at ages birth to 3 or from ages 3 to 4. In consequence, policymakers and the public cannot appropriately evaluate the level of publicly funded support for early childhood education.
There are important opportunities in the near future to expand provision of early childhood education across the Big Ten ELA states, and we encourage these states to work together to pursue these opportunities.
First, states need to develop data systems that allow for full representation of the number of children supported by public funds who receive early childhood education. The data systems should allow for unduplicated counts of children served across all state and federal programs, as well as complete accounting of public expenditures from all local, state, and federal sources. This would include both enrollment and spending for public schools offering district-supported early childhood programs. This would enable policymakers to validly evaluate both the number of children served through public funds, and the total public expenditures on those children, when these policymakers face decisions on their states’ early childhood policies.
Second, opportunities exist across all states to expand public funding for early childhood to allow more children at all ages to participate, and to adopt policies to support the quality needed to ensure children’s learning and development benefits from this expansion. The Big Ten ELA states might benefit from sharing information about policies and child outcomes, with particular attention to each state’s systems to support continuous improvement.
Finally, one of the best sources of information for improving early childhood policies would be state-specific data linking preschool program participation to such longer-term outcomes as scores on state standardized tests, special education placements, high school graduation, and enrollment in higher education. Part of the rationale for many investments in early childhood programs is to capitalize on the potential return on investment of preschool participation, such that for every dollar put into the system, dividends are returned in the future. To our knowledge, none of the Big Ten ELA states has data systems enabling such analyses for public use, which would require a state to link data on enrollment and subsidy receipt in public early childhood programs to the state’s K-12 and higher education databases. The Big Ten ELA states should look to other states, such as Georgia, that have created the data linkages that allow for analysis of the long-term relationships between early childhood participation and future educational outcomes.
References
Administration for Children & Families (2022). FY 2019 Final Data Table 1 – Average Monthly Adjusted Number of Families and Children Served. ACF-801. U.S. Department of Health and Human Services. https://www.acf.hhs.gov/occ/data/fy-2019-final-data-table-1 (accessed July 16, 2024)
Administration for Children & Families (2024). FY 2021 Preliminary Data Table 1 – Average Monthly Adjusted Number of Families and Children Served. ACF-801. U.S. Department of Health and Human Services. https://www.acf.hhs.gov/occ/data/fy-2021-preliminary-data-table-1 (accessed July 16, 2024)
Barnett, W. S. (1985). Benefit-cost analysis of the Perry Preschool Program and its policy implications. Educational Evaluation and Policy Analysis, 7(4), 333-342.
Barnett, W. S., Bernal, R., & Nores, M. (2020). The contributions of economics to early childhood education and care. Gullo & Graue, eds. Scientific Influences on Early Childhood Education, 119-131. New York: Routledge.
Centers for Disease Control and Prevention (2024). Natality on CDC WONDER Online Database. Data are from the Natality Records 2016-2022. National Center for Health Statistics. National Vital Statistics System. http://wonder.cdc.gov/natality-expanded-current.html (accessed July 16, 2024)
Friedman-Krauss, A. H., Barnett, W. S., Hodges, K. S., Garver, K. A., Jost, T. M., Weisenfeld, G., & Duer J. (2024). The State of Preschool 2023: State Preschool Yearbook. New Brunswick, N.J.: National Institute for Early Education Research.
Friedman-Krauss, A. H., Barnett, W. S., & Duer, J. K. (2022). The State(s) of Head Start and Early Head Start: Looking at Equity. New Brunswick, N.J.: National Institute for Early Education Research.
Lapointe, V. R., Ford, L., & Zumbo, B. D. (2007). Examining the relationship between neighborhood environment and school readiness for kindergarten children. Early Education and Development, 18(3), 473-495.
Reynolds, A. J., Temple, J. A., Robertson, D. L., & Mann, E. A. (2001). Long-term effects of an early childhood intervention on educational achievement and juvenile arrest: A 15-year follow-up of low-income children in public schools. JAMA, 285(18), 2339-2346.
Reynolds, A. J., Temple, J. A., White, B. A., Ou, S. R., & Robertson, D. L. (2011). Age 26 cost-benefit analysis of the child-parent center early education program. Child Development, 82(1), 379-404.
Shrider, E.A., & Creamer, J. (2023). Poverty in the United States: 2022. U.S. Census Bureau, Current Population Reports, P60-280. Washington, D.C.: U.S. Government Publishing Office. https://www.census.gov/content/dam/Census/library/publications/2023/demo/p60-280.pdf
U.S. Census Bureau (2022a). Annual Estimates of the Resident Population by Single Year of Age and Sex: April 1, 2020 to July 1, 2022. SC-EST2022-SYASEX. U.S. Department of Commerce. https://www.census.gov/data/datasets/time-series/demo/popest/2020s-state-detail.html (accessed January 19, 2024)
U.S. Census Bureau (2022b). 2022: American Community Survey 1-Year Estimates: Subject Tables. S1101. Households and Families. U.S. Department of Commerce. https://data.census.gov/table/ACSST1Y2022.S1101?g=010XX00US$0400000 (accessed September 19, 2024)
U.S. Census Bureau (2022c). 2022: American Community Survey 1-Year Estimates: Subject Tables. S1701. Poverty Status in the last 12 Months. U.S. Department of Commerce. https://data.census.gov/table/ACSST1Y2022.S1701?g=010XX00US$0400000
Author Note
Activities of the Big Ten Early Learning Alliance are supported in part by a generous gift from American Family Insurance to The Ohio State University. Correspondence about this work may be addressed to Laura Justice (justice.57@osu.edu).
The views reflected in this paper are those of the authors and do not represent the Big Ten Academic Alliance or member universities.
The recommended citation for this paper is: Justice, L.M., & Barnett, S.W. (2024). State of Early Childhood Education in Big Ten States. Columbus, Ohio: Big Ten Early Learning Alliance.
Acknowledgement
The authors would like to thank members of the Big Ten Early Learning Alliance Steering Committee for their feedback on this brief. The authors would also like to thank the Policy and External Affairs team at the Crane Center for Early Childhood Research and Policy at The Ohio State University: Jamie O’Leary for reviewing the brief; Michael Meckler for data retrieval, copy edits and dissemination; Janelle Williamson for project management; and Cathy Kupsky for designing the PDF version of this brief.
The Big Ten Early Learning Alliance
The Big Ten Early Learning Alliance brings together early childhood experts at the nation’s Big Ten universities, representing 14 universities across 11 states, to strengthen early childhood policies and practices through science.

American Family Insurance Dreams Foundation believes that equity in education — including early education and care — can be a pivotal lever to break cycles of generational poverty for students and their families. Early education and care are leading priorities in our Equity in Education investment strategy. We invest in equity-centered innovation focused on a strong and diverse educator pipeline, research and coalition-building, direct family and community services, and business/funder roundtables.
- At this time of this writing, the Big Ten Early Learning Alliance comprises experts from Indiana University, Michigan State University, Northwestern University, The Ohio State University, the Pennsylvania State University, Purdue University, Rutgers – The State University of New Jersey, the University of Illinois Urbana-Champaign, the University of Iowa, the University of Maryland, the University of Michigan, the University of Minnesota, the University of Nebraska-Lincoln, and the University of Wisconsin. With expansion of the Big Ten to include universities in California, Oregon, and Washington in the summer of 2024, we expect representatives of those schools to join the Big Ten ELA and future briefs to include those states. ↩︎
- A visual representation of these 10 benchmarks is available at https://nieer.org/sites/default/files/2023-
08/benchmarks-check-list-png-410×1024.png (retrieved July 19, 2024). ↩︎
 American Family Insurance Dreams Foundation believes that equity in education — including early education and care — can be a pivotal lever to break cycles of generational poverty for students and their families. Early education and care are leading priorities in our Equity in Education investment strategy. We invest in equity-centered innovation focused on a strong and diverse educator pipeline, research and coalition-building, direct family and community services, and business/funder roundtables.